

In this blog we are walking through how to improve performance of application using Yourkit profiler it is helpful for both Tester and Developers.
Your Kit is big achievement in the evolution of the profiling tools. It is intelligent tools for profiling java , .net and ( JVM support languages) based applications.
It is often important to check memory usage and memory used per process on servers so that resources do not fall short and users are able to access the server. It is very effective for any application.
Problem Related Issue for any application
If there is memory related issues that are present in our application it slows down the performance and memory-related problems:
- Application uses more memory than it should
- Out of Memory occurs when jvm cannot allocate object because it is out of memory.
- Memory leaks
- Application creates a lot of temporary objects
Due to these problems our application leads to serious overall system performance degradation.
Your kit is very helpful for recognizing these types of problem for improving performance of the application. For execute profiler one should run this command:
/bin/yjp. sh
MEMORY USAGE
In Memory tab if we select Memory and GC telemetry section showing the memory related graphs.In which
- Heap Memory shows Java heap statistics.In this we can easily see individual pools or all pools together.Java uses the heap as the storage for Java objects.
- Non-Heap Memory shows the non-heap memory statistics. Java uses the non-heap memory to store loaded classes and other meta-data. You can see individual pools or all pools together.
- Classes shows how the number of loaded classes changed in time, and the total number of unloaded classes.
- Garbage Collection and GC pauses show the garbage collection statistics
- Object Allocation Recording graph shows the number of objects created per second.

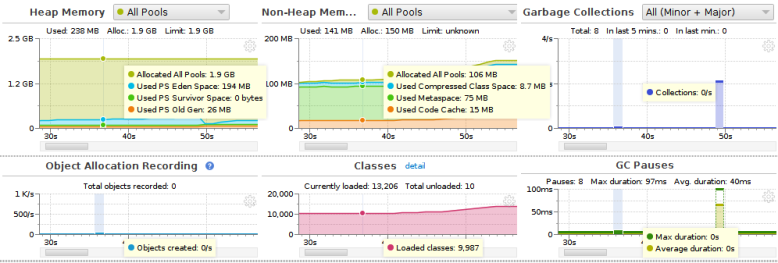

Here you see the current memory allocations and number of objects has been created and size reserved.
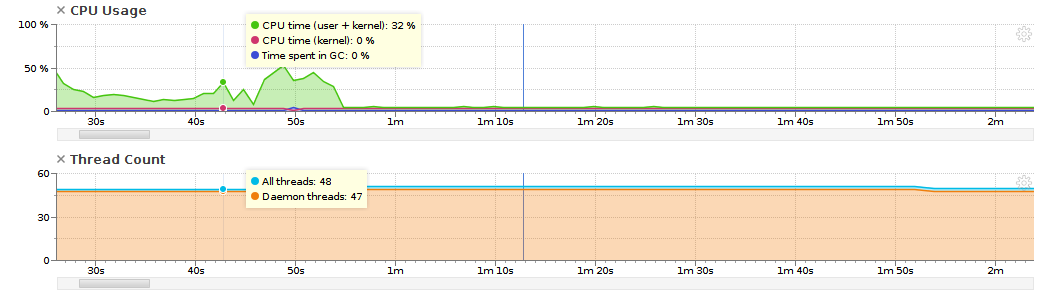
CPU Usage
CPU tab shows CPU consumption statistics. It is available when you are connected to the profiled application.

Performance Chart
In this tab we are able to catch all the statistics performance at one place e.g CPU, Memory etc.


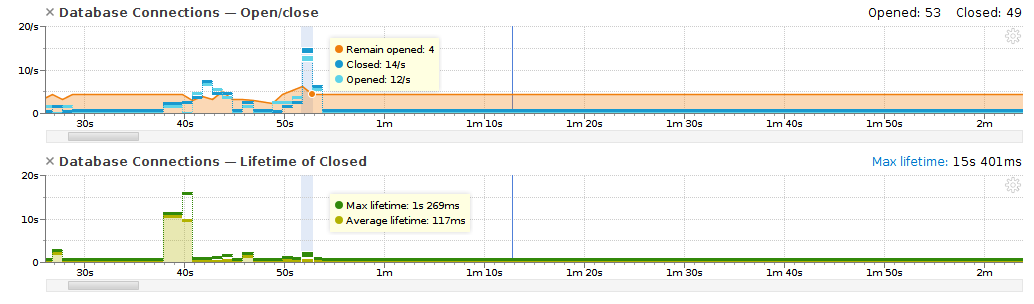
Using this we can improve performance of our application and make it effictive.
I hope this blog shows you what you can do with YourKit java profiler.
Refrences

Reblogged this on Scala Lovers.