Performance Tuning is one of the stages of taking your application to production which you can seldom avoid. Irrespective of the fact whether you have taken all good performance practices into account, there is something or the other which needs to be tuned before the application is production ready.
Performance Tuning takes a different turn when your application is supposed to run on the cloud. You have to test the application in an environment which is shared. The caveats are not as much for a IaaS Cloud as compared to a cloud platform offering like Google App Engine. Here your application would be residing with thousands, millions? of other applications and they would be using the same platform. You can not tweak the PaaS JVM parameters just for yourself. You cannot control how much time the RPC calls are going to take. So what is the best way to performance test/tune the application on GAE?
In this post we would talk about JAVA application deployment and testing but the same concepts could be applied to Python for GAE.
First and foremost make sure that the application follows all the good design principles and practices that we followed even when we were not on the cloud. The main tips still remain
- Limited network calls (historically, for all applications, the most expensive calls have been the database calls), a close second are the calls made to other resources over the network like webservices, RPC calls etc.
- Make use of the Cache for data which needs to be fetched again and again from the database and does not change that often.
- Check that you are not making query calls in a loop, I usually find some of these all the time 😉
- Reuse, existing objects, avoid fetching them again, reuse code, write smaller methods etc etc. More tips here
- And the first tip to be kept in mind, do not get into unnecessary optimization of code right from the beginning. Over optimization makes you waste more time than you save.
GAE provides us with a cool tool called Appstats. Appstats is easy to configure and can be configured as a servlet filter which intercepts the request on the way in and hooks itself to the RPC calls so that it can give you some statistics back. It records statistics for all API calls made during the request handler, then stores the data in memcache. Appstats retains statistics for the most recent 1,000 requests (approx). The data includes summary records, about 200 bytes each, and detail records, which can be up to 100 KB each.
As expected, the API hooks add some overhead to the request handlers, however, nevertheless google says that we can keep it running in the production environment too without too much degradation on the performance. Of course, the other recommendation is also that if you do not want it then turn it off.
Appstats adds a message to the logs at the “info” level to report the amount of resources consumed by the Appstats library itself. The log line looks something like this:
[sourcecode language=”text”]
INFO 2009-08-25 12:04:07,277 recording.py:290] Saved; key: __appstats__:046800, part: 160 bytes, full: 25278 bytes, overhead: 0.019 + 0.018; link: http://appid.appspot.com/stats/detail?time=1234567890123
[/sourcecode]
This line reports the memcache key that was updated, the size of the summary (part) and detail (full) records, and the time (in seconds) spent recording this information. The log line includes the link to the Appstats administrative interface that displays the data for this event.
Real world!
When we configured appstats on my local environment then we started facing this issue. As soon as we hit http://localhost:8080/appstats we were greeted with
[sourcecode language=”text”]
java.lang.NullPointerException
at java.io.Reader.(Reader.java:61)
at java.io.InputStreamReader.(InputStreamReader.java:80)
at com.google.appengine.tools.appstats.TemplateTool.loadTemplateSource(Templat eTool.java: 115)
at com.google.appengine.tools.appstats.Renderer $1.loadTemplateSource(Renderer.java:49)
at com.google.appengine.tools.appstats.TemplateTool.getTemplate(TemplateTool.j ava: 142)
at com.google.appengine.tools.appstats.TemplateTool.format(TemplateTool.java: 100)
at com.google.appengine.tools.appstats.Renderer $1.format(Renderer.java:59)
at com.google.appengine.tools.appstats.Renderer.renderSummaries(Renderer.java: 74)
at com.google.appengine.tools.appstats.AppstatsServlet.doGet(AppstatsServlet.j ava: 140)
at javax.servlet.http.HttpServlet.service(HttpServlet.java:693)
[/sourcecode]
If you notice, this is not a ClassNotFoundException, so AppstatsServlet is found and it encounters an issue somewhere. After spending a good couple of hours we included the labs jar as a part of the application lib. (Notice the commented out scope)
[sourcecode language=”xml”]
<dependency>
<groupId>com.google.appengine</groupId>
<artifactId>appengine-api-labs</artifactId>
<version>${gae.version}</version>
<!– <scope>test</scope> –>
</dependency>
[/sourcecode]
I am still wondering if appstats needs to be packaged with TaskQueue in the labs jars. Still to hear google back on that one.
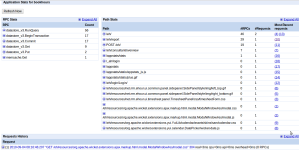
After this change the appstats started working and if we hit appstats, we get these kind of chart + details.
For starters this is how your page would look like once you hit http://localhost:8080/appstats

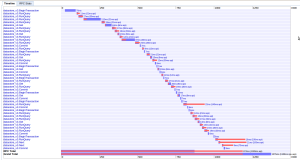
At the bottom of the screen you would see requests which were sent to the app engine. Once we click on them, you would see a chart like this

Now, let us see how to read this chart.
Blue bars show the actual time spent on the API call. If this is more in terms of time, you need to decide on how to reduce the time. The options available to you would range from
- Do not make the RPC call at all or,
- Make the call less heavy
The red line shows the API time charged for the call by App Engine. The RPC total shows the total time spent on RPC calls and the Grand Total is the total time spent on the request. So, in the above chart, 874 ms was the time spent on RPC calls and the total time spent was 1365 ms. Hence it means that a good portion of around 500 ms was spent on the non RPC code which was your business logic. If there is a way to fine tune that then please go ahead.
So in a nutshell, appstats would allow you to find hot requests and RPC calls taking a lot of time, allows you to drill down to the stackframes, gives you information about all RPC calls and not just datastore calls.
One place where appstats would leave something to desire would be show how those 500 ms are spent on the non-RPC calls. There exists no mechanism yet and we did not get to profiling our code yet but there seems to be a way. Ingo Jaeckel has a 3 minute screencast which shows how to profile the GAE application with jProfiler.
Some of the early issues that we found with our code when we started using appstats were
- Repeated fetching of entities, we would rather cache them in Memcache now.
- Unnecessary queries for fetching multiple entities one at a time.
- Ineffective use of Caching
- Used a JPA query to fetch an object instead of using a get(). In our case since we are migrating a legacy application to the app engine platform fetching all entities with a get is not possible, but there are places where it is possible.
Some of the other places to look at in our code would be the possibility of using multi-get API and asynchronous URL fetch. Any other ideas are welcome, as always.


thanks nice blog 😉
Thanks for this post. I spent countless hours trying to understand why appstat was not working for me. This damn in my pom.xml was the solution.
Thank you for the ‘appengine-api-labs’ pom dependency!