

This is last blog of this series in this we will read how to monitor CPU Utilization by Dynatrace.
Why we always need memory analysis ?
We need memory analysis is to optimize garbage collection (GC) in such a way that its impact on application response time or CPU usage is minimized. If garbage collection has a negative impact on response time, our goal must be to optimize the configuration.
In Dynatrace, we have full analysis of memory utilization. A healthy system performs better. Dynatrace uses defined parameters to monitor health. These parameters use metrics such as CPU, memory, network, and disk.

Here You can see these values in the Transaction Flow on the respective agent node. Use this to identify the impact of an unhealthy host on your business transactions.

We can easily go through the execution of the each thread as like below figure.

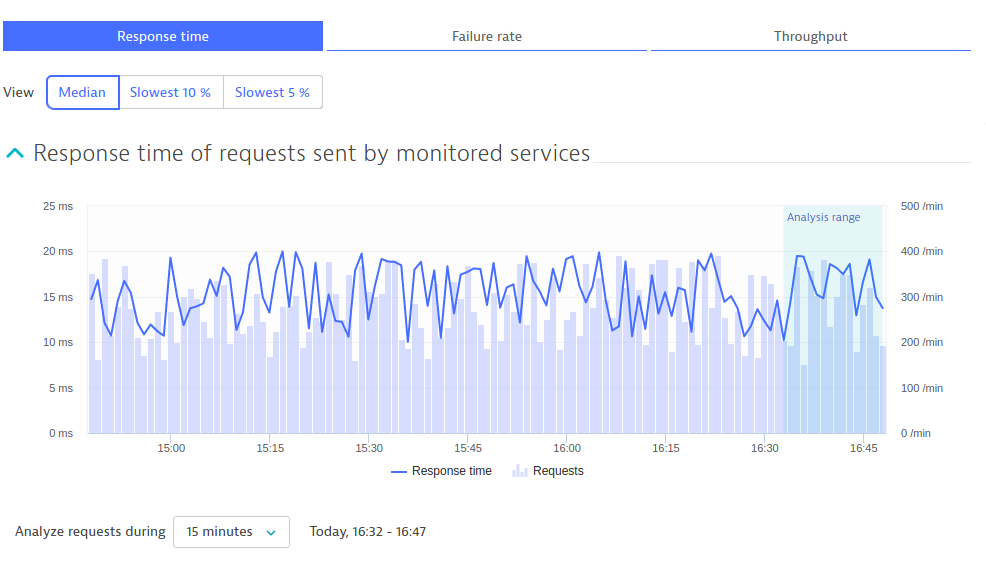
You can use the filter list in the top right corner to filter the content to the Median, slowest 10% or fastest 90% of transactions in the session. below chart gives a quick impression of the typical response times. Dynatrace captures CPU time used by the threads that are executing this transaction for selected time frame. And like this we can also go through failure rate and Throughput.
Dynatrace includes the different customizable report .It is Generateing reports of dashboards in various formats in the Dynatrace Client.At we can Schedule reports to execute periodically and publish them via email, or store the reports in the file system as below figure.

In the end we can confidently say that this tool is very helpful for our performance testing we can easily solved our problem in minutes.
References:
Reblogged this on sandeepknol.