

The three opensource projects Elasticsearch, Logstash, and Kibana make up the ELK Stack. Now after installing ElasticSearch we will install the Logstash and Kibana.
Steps to install ELK Stack
Step 5- Install Kibana for ELK
Now we will install Kibana next. Kibana is a visualization layer that works on top of Elasticsearch. It is a GUI for parsing and interpreting collected log files.
To install Kibana use the following command-
sudo apt-get install kibana
After that configure the Kibana by editing file Kibana.yml
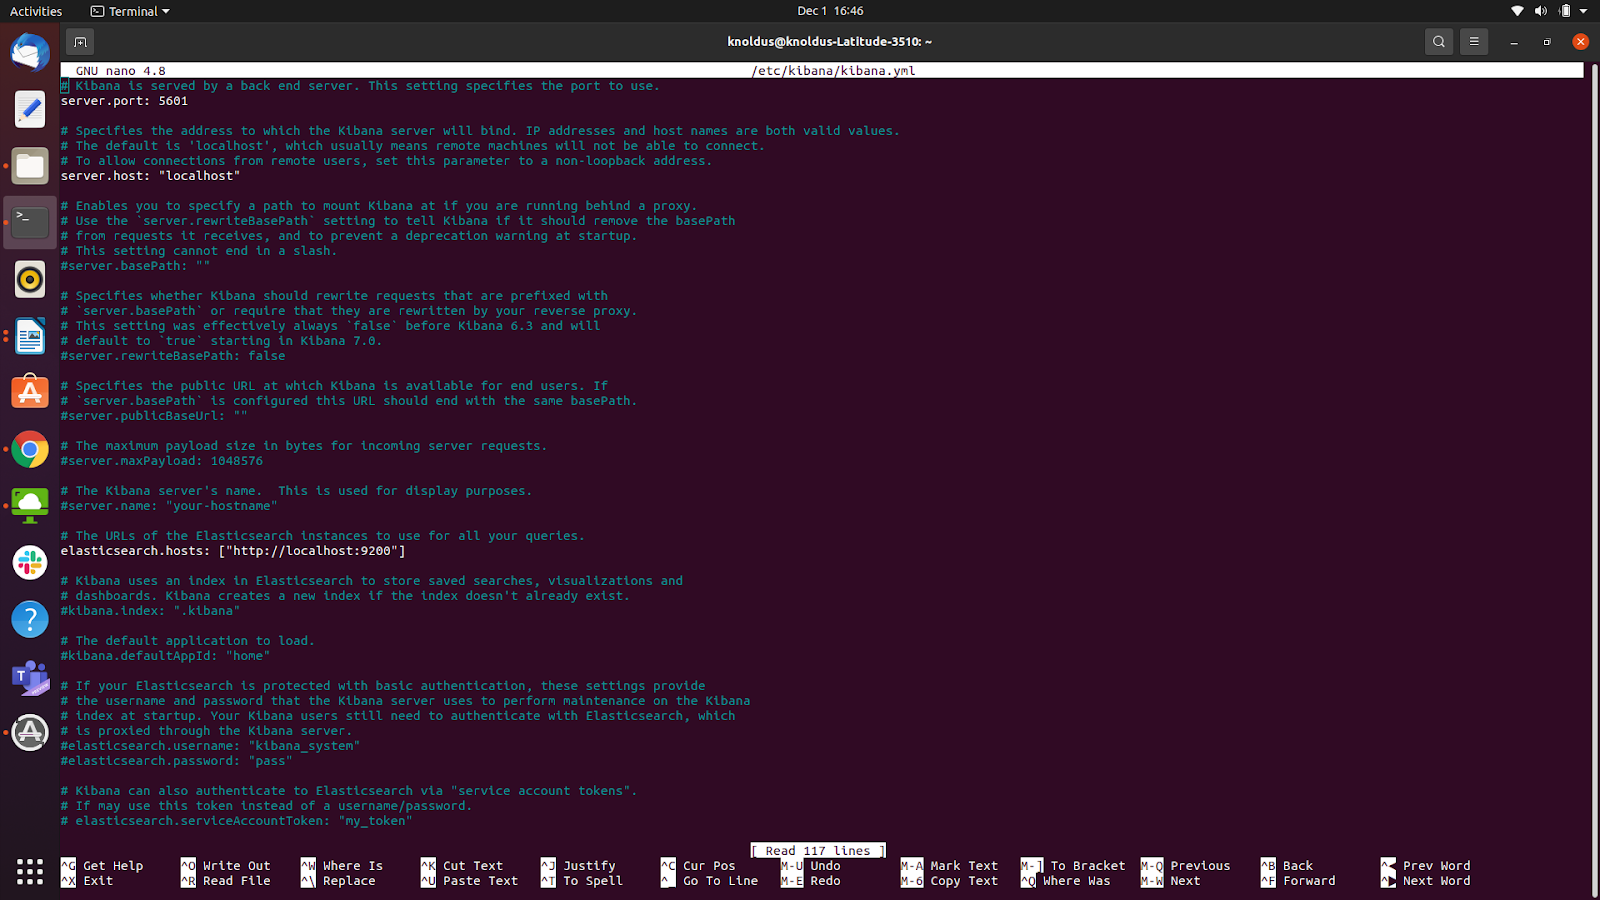
sudo nano /etc/kibana/kibana.ymlUncomment the following lines by removing # from front of the lines
#server.port: 5601
#server.host: "your-hostname"
#elasticsearch.hosts: ["http://localhost:9200"]
It should look like this-
After that start and enable Kibana service-
sudo systemctl start kibanaConfigure Kibana to launch at boot
sudo systemctl enable kibana
Test Kibana
So, now go to the following link to access Kibana
http://localhost:5601After you hit the above link you will see the below page-

So the kibana dashboard has loaded.
Step 6- Install Logstash for ELK
Logstash is a log-aggregator, that ingests data from multiple sources. It ships, process and store logs.
To install Logstash use the following command-
sudo apt-get install logstash
Start and Enable the Logstash Service
Start the Logstash Service
sudo systemctl start logstashEnable the Logstash Service
sudo systemctl enable logstashCheck the status of Logstash Service
sudo systemctl status logstash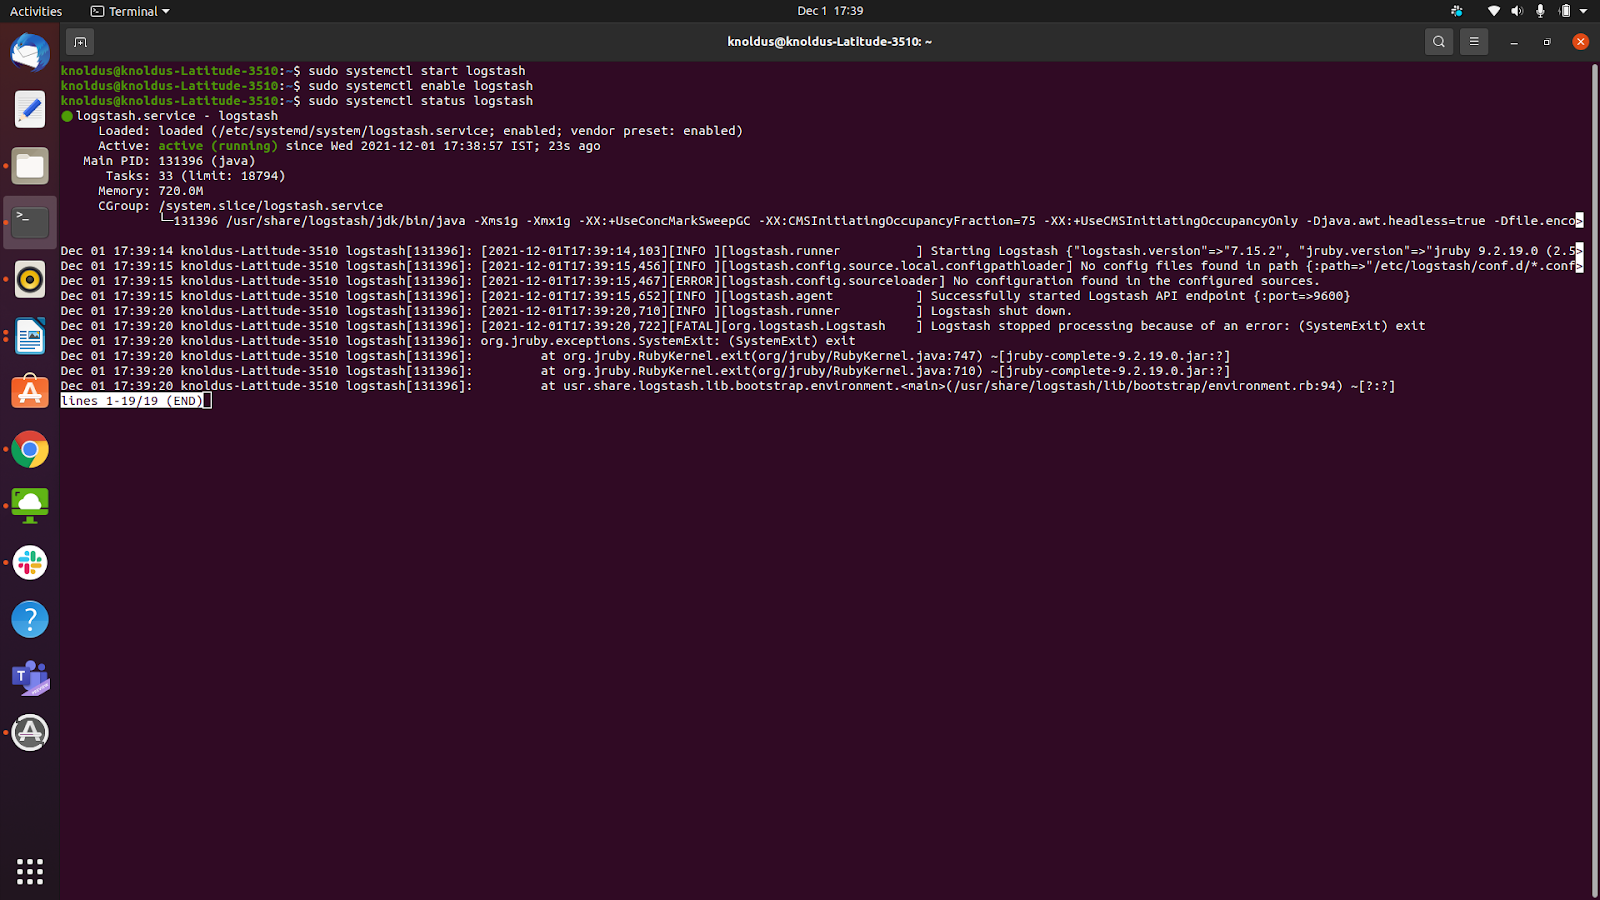
Now we can go to the Kibana dashboard and check the logs, create some alerts on these logs, we can even create our own dashboards.
But first we will be needing data. So for this we will go to home and then we can select either add your data or sample data.

We will select try sample data. We can add any from the three choices provided.

Meanwhile we can check the logs of the sample data we chose. To see the logs you can go to observability , then to logs and check the stream

Now to create alerts go to the top right corner and click on Alerts and rules
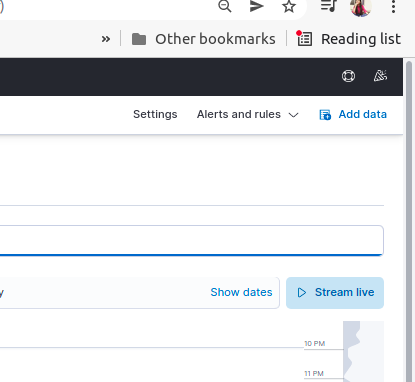
After clicking on Alerts and rule , select create rules. And now you can create rules according to your needs. Kibana provides built in integration for notification to email, webhooks, IBM Resilient, Jira, Microsoft Team, PagerDuty, ServiceNow, and Slack.
Conclusion
To sum up we can say ELK Stack is useful to resolve issues for the centralised logging system. Since it is open source it has a vast supporting community.