


Hey Guys, I hope you are doing well in this pandemic of COVID-19. Let’s move to the next blog in a series of performance testing. In my earlier blogs, we came to know about creating scripts in JMeter and working with them. Now in this blog, we will learn how to Integrate JMeter into Jenkins Basically, we will execute the JMeter script through/CD tool.
Now first discuss what is Jenkins and why we need to integrate JMeter into Jenkins. After that, we will move to how to integrate Jmeter in Jenkins.
Jenkins :
Jenkins is an open-source automation server written in Java. It is used to implement CI/CD workflows, called pipelines.
Why we need to integrate the JMeter into Jenkins –
- Unattended test executions right after a software build and deploy
- Automatic build failures in case of performance degradation
- Easy access to test reports that show application metric trends – all tests are in one place and available to anybody with the correct permissions
- Automated routine work of test configuration, execution, and baseline results analysis. Users’ hands and minds are free for more important, complex, and interesting tasks.

How to Configure Jmeter in Jenkins-
- Installation –
- To configure Jmeter in Jenkins, we need to first install the Jenkins in your machine or in any virtual machine. You can use this link here to install Jenkins in your machine.
- After setting up Jenkins, Go to the Manage Jenkins–>Manage Plugins–>Available. Here you need to install 2 plugins in Jenkins.
- Performance plugin
- Git Plugin
- Next, you need to install the JMeter on the same machine. You can see my other blogs to write scripts in JMeter and install Jmeter here
Note:- Both Jenkins and Jmeter should be installed on the same machine and connected to the same network also.
2. Git Integration in Jenkins
Note-: Your Jmeter scripts should be placed in git so that Jenkins will clone the updated script from git and execute.
- Go to Jenkins–>Manage Credentials
- Click on Jenkins Credentials so you will be redirected to the Global credentials (unrestricted) page
- Click on Add Credentials from the left pane.
- Add the Git Credentials with SSH username and Private Key of your git repository.
- Enter your passphrase and click ok.

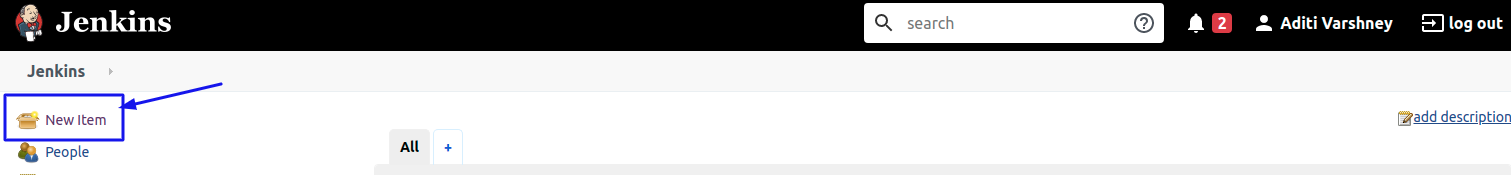
- Create Jenkins Job-
- Go to the New item from the left pane
- Now create the freestyle project in Jenkins and name it as Jmeter or any you want.
- Click Ok to create the job.

- Configure Jenkins Job-
- Click on the Job you have created from Jenkins Dashboard
- Now from the left pane click on Configure.

- Add the description as per your need.
- Add some of the parameters like thread group and ramp up time.

- Next, Go to Source Code management and select Git.
- Add Repository URL and select git from credentials
- Add the branch in Branch Specifier on which the script is committed
- Now Go to the build section and select execute shell .
- Paste this shell script in that .
cd /home/aditi/apache-jmeter-5.3/bin
sh jmeter.sh -Jjmeter.save.saveservice.output_format=csv -JThread=$Thread -JRampUp=$RampUp -n -t ${WORKSPACE}/Thread_Group.jmx -l ${WORKSPACE}/${BUILD_ID}/Report/test.jtl -e -o ${WORKSPACE}/${BUILD_ID}
- Add Post Processor- Publish performance test result report.
${WORKSPACE}/${BUILD_ID}/Report/test.jtl

- Click on Apply and save the job.
5.Edit Jmeter Script
- In this, you need to update the thread group and ramp-up value in your JMX file.
- Go to the Thread Group and add
${__P(ThreadGroup,1)}in thread group and${__P(RampUp,5)}in ramp-up. - Commit the updated script in GIT.

6.Execute Jmeter Jenkins Job-
- Click on the Created job from Jenkins Dashboard
- Click on Build with parameter from the left pane.
- Add the values of parameter Thread Group and RampUp.
- Click on the build to execute the job.

- After Job runs ,check the logs and result from the console output.

- Also you can check the Performance reports from the Performance Trend .
- Check the performance report in the workspace also.
So this is how we can execute the Jmeter script with Jenkins. If you have any questions and queries related to Jmeter execution, you can ask in the comments. I’ll provide the solution asap. Also, I have created the template so that you can take help from that as well. I’ll provide the link to the template in the comments section.
I hope you enjoyed it and it helped you!! stay connected for more future blogs.
Thank you!!
🙂
References:
