KNIME Analytics Platform is open-source software for creating data science applications and services. Intuitive, open, and continuously integrating new developments, KNIME makes understanding data and designing data science workflows and reusable components accessible to everyone.
With KNIME Analytics Platform, you can create visual workflows with an intuitive, drag and drop style graphical interface, without the need for coding.
Hello, folks! In this blog, we will analyse the ICC test cricket data using KNIME analytics platform and find some exciting results. I hope you will enjoy the blog.

Exploring the Dataset:
ICC Test cricket is the form of the sport of cricket with the longest match duration and is considered the game’s highest standard. Test matches are played between national representative teams that have been granted ‘Test status’, as determined and conferred by the International Cricket Council (ICC). The term Test stems from the fact that the long, gruelling matches are mentally and physically testing. Two teams of 11 players each play a four-innings match, which may last up to five days (or longer in some historical cases). It is generally considered the most complete examination of a team’s endurance and ability.
The Data consists of runs scored by the batsmen from 1877 to 2019 December.
Sample of dataset:

The dataset consists of several features:
| Feature | Description | Data Type |
| Player | The Player details including name and country | String |
| Span | The Time span of player played for the country | String |
| Mat | Total No of matches played | Integer |
| Inn | Total no of innings played in the matches | Integer |
| NO | No of times player Not Out on his high score | Integer |
| Runs | Total no of runs | Integer |
| HS | High score in whole Span | String |
| Avg | Average runs per match | Double |
| 100 | No of Centuries in whole span | Integer |
| 50 | No of Fifties in whole span | Integer |
| 0 | No of duck in his Span | Integer |
So, first we have read the data from the given .csv file with the help of KNIME File reader node.
Pre-Processing the data:

After Read the data now, there is a profile column which is not usable for us. So we have used column filter to filter out that row from the data.
Then, the HS(High score) column contains the highest score and the status at high score whether they were out or not out. So in next node we have filter out that status and saved that status in a separate column.
Now, we have to find out the time-span( No of years) of a player they played for his country. So we have used column expression node in which we have find out the time-span and separate it into a new column.
After that, In the player column of data we have the player name and the country name of the player. So we have to filter out the player name and the country. For that we have used the component in which we have done it with the help of multiple column expression node.
Cleaning the Data:
We have done with the pre-processing part of data. Now we have to clean the data in which we have to handle the missing value from the data and remove some extra columns from the data set.
Look over the results:
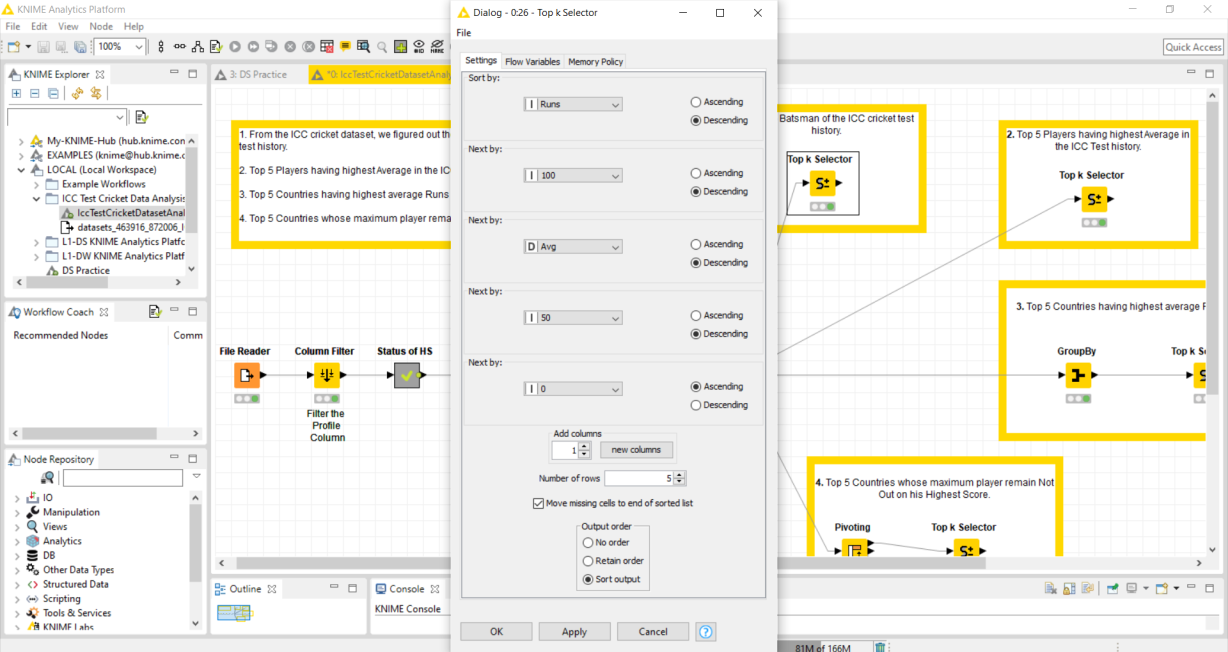
1. TOP 5 Batsman of the ICC cricket test history.
To find the Top 5 Batsman of the ICC Test Cricket history, we have used the Top k selector node which the following configuration:

Result data:

2. Top 5 Players having highest Average in the ICC Test history.
To find the Top 5 players having highest average in the ICC Test history, we have used Top k selector having Highest score in the configuration.
Result data:

3. Top 5 Countries having highest average Runs by the Players.
To find out the Top 5 countries having highest average runs by the players in his ICC Test career first we have filter out the countries with his average player score by the help of Group by node. After that we have used Top k selector node to filter out the top 5 countries.
Result data:

4. Top 5 Countries whose maximum player remain Not Out on his Highest Score.
To find out the Top 5 countries whose maximum player remain Not out on his highest score, first we have used the pivoting node to aggregate the countries with the highest score status. After that we have used Top k selector to filter the Top 5 countries with respect to the highest score status.
Result data:

You can download and view the complete workflow on the KNIME-HUB.
Note: I hope our blogs help you to enhance your learning. I’ll post more blogs on KNIME. Stay Tuned.


