

Hi folks,
In this blog, we will learn about the cypress dashboard specifically and will explore its features. On top of that, we learn how to generate a shareable HTML report for test in cypress. So, let’s get going.
What is Cypress Dashboard?
The Cypress Dashboard Service is an optional web-based companion to our cypress test runner. It basically, provides a timely, simple and powerful insights on all our tests run at a glance. In simple words, one may define it as an overview portal/dashboard which contains almost all the pieces of information about our test and its execution. It has an interactive UI based experience that allows us to debug and identify the issues like test failures, etc.
How to access Cypress Dashboard?
Firstly, we need to open our cypress runner. Then, we have an option named “Runs” on top of the runner, click on it and you find yourself encountering a screen, something like this

This screen prompts us to log in first. Click on the “Login in to Dashboard” button and we will be directed to a new screen on our browser. Here, we have multiple options to log in, we can choose any of them.

Moving on, since we have done with the login part, let’s talk about the features of this dashboard.
Features of Cypress Dashboard
- The most admirable thing about the dashboard is its showcase of test summary. Anyone having access to the cypress dashboard of a certain project can have access to all the information about the test, like duration of execution, the number of tests, we can also classify test based upon success or failure.
- On top of these, we also have recorded videos of test execution. For the failed test, we also have a screenshot of the instance where they have failed.
- All this information is available on the cypress dashboard. The stakeholders, if they have access to the dashboard, can also view these informations in a single place. That’s the beauty of cypress.
Generally, for most of the test automation tools, we need to add logic/code to record videos or take screenshots upon failure. But in cypress, we don’t need to concern ourselves with these, cypress does this work for us.
Moving on, let’s see as step by step description of recording the test.
Recording the test
After logging in, we will be asked either to enter the name of an organization or to set up a personal project. We’ll choose the latter one, the personal project. After filling, in the required fields, like project name etc, we will be redirected to the following screen.
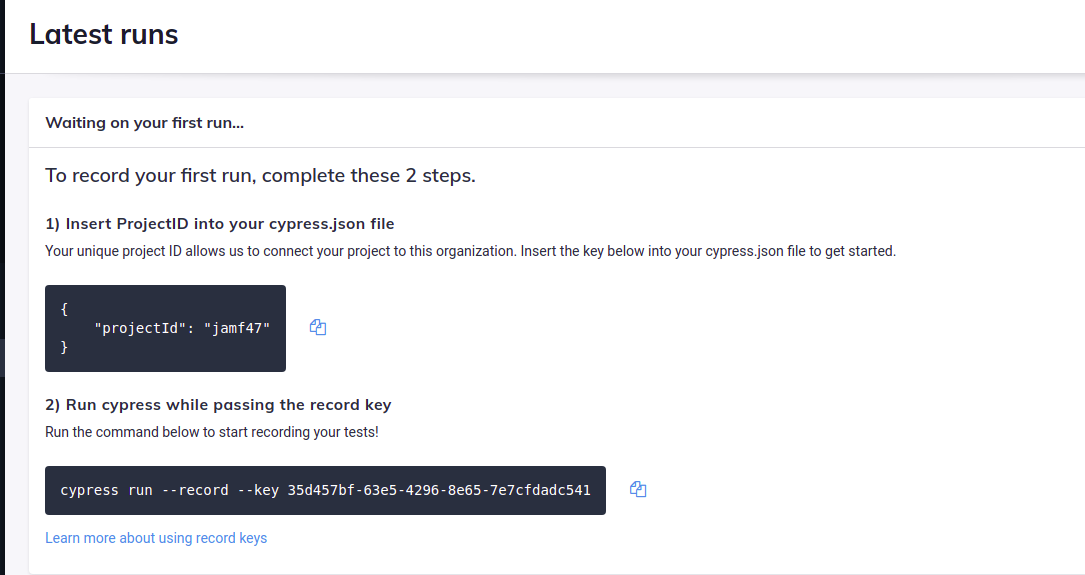
Now, we have a project id with us. It is nothing but a unique identifier for the project. We need to add this project Id to our cypress.json file and save it so that cypress runner could recognise our test.
On adding this project Id to our cypress.json file, we can see that the “Runs” sections in the cypress runner is displaying the project Id.

Now, we are all test, cypress dashboard has been configured with our project. Moving on to the recording part, we would have to use the command as displayed on the image above.
node_modules/.bin/cypress run --record --key 35d457bf-63e5-4296-8e65-7e7cfdadc541That’s it, execute this command and the test execution will be reflected in the cypress dashboard.
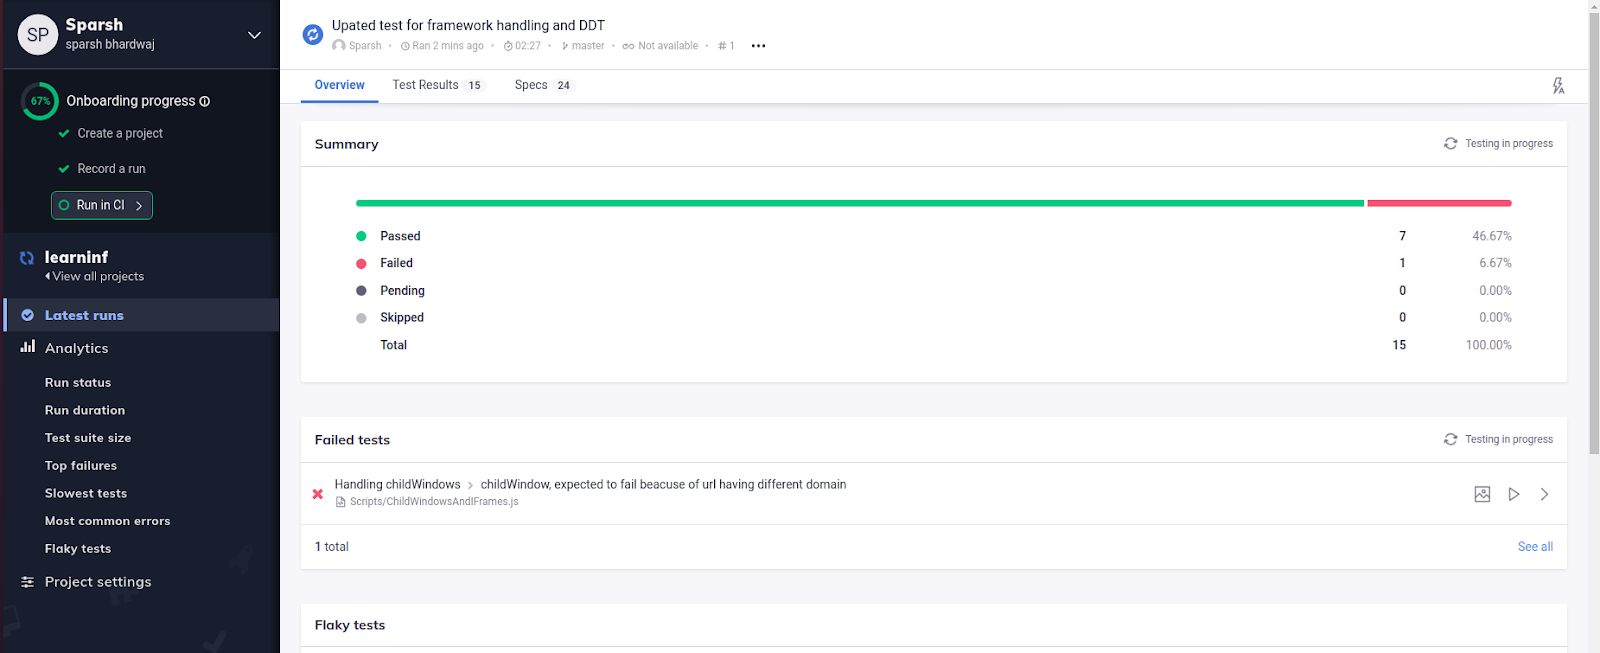
In the image below, we can see that the test execution has started already.

Here, we can see all the information about our tests, if we click on any of the tests, we can see the entire stack trace of that. We do get the option of playing the recorded video as well which is marked with a play button. For every, failed test case a corresponding screenshot is also there. The overall summary looks something like this
That’s the beauty of cypress. And on top of these, we do get the benefit of CI/CD pipeline integration as well.
Furthermore, we have one more thing to cover, reporting.
Reporting in Cypress
Cypress does not create a shareable HTML report on its own. Therefore, we would have to resort to an external plugin, which is, Mocha Awesome reporting plugin. To install the plugin, please execute the command at the project root level
npm install --save-dev mochawesomeMocha already comes in the cypress bundle, it is already there in the node_modules, but it is always recommended to download mocha as well a peer dependency so that mocha awesome gets configured correctly. We can do so by using the command
npm install --save-dev mochaNow, all we have to do is to run our test with –reporter tag and automatically we will have a test report with us. We can do so, by using the command
node_modules/.bin/cypress run --reporter mochawesomeThe above command will execute all the test cases in our project and will generate a report for it in the newly generated mochawesome-report folder. If we want to execute a single test file, we can do by using the following command.
node_modules/.bin/cypress run --reporter mochawesome --spec <path to your test file>
A sample report looks something like this,

That’s all folks. I hope you may have found this useful.
References
https://www.npmjs.com/package/mochawesome
https://www.cypress.io/dashboard/
